How to Create a Report
ClayHR empowers you to create insightful reports through its intuitive report designer. With a wide range of customization options, it allows you to transform raw data into meaningful views tailored to specific needs.
Watch a Quick Video Tutorial
Create a New Report
Here are the steps to create a new report:
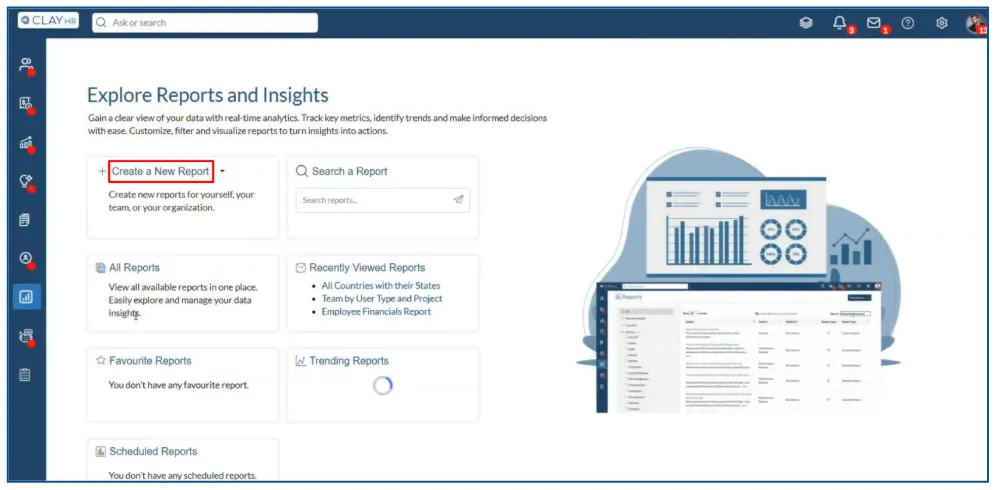
- Hover over the “Analytics” menu icon on the left menu and select “Reports”. You will be redirected to the reports landing page.

- Go to the “Create a New Report” widget and click on it. The “New Report” pop up window will open up.
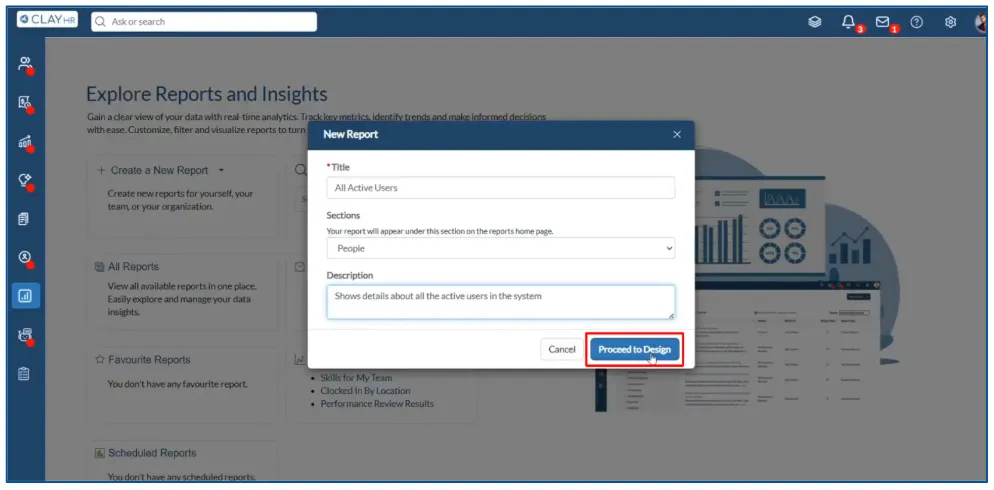
- Enter the report name and description and select the section under which the report should be shown.
- After you are done, click on the “Proceed to Design” button. You will be redirected to the report designer page.
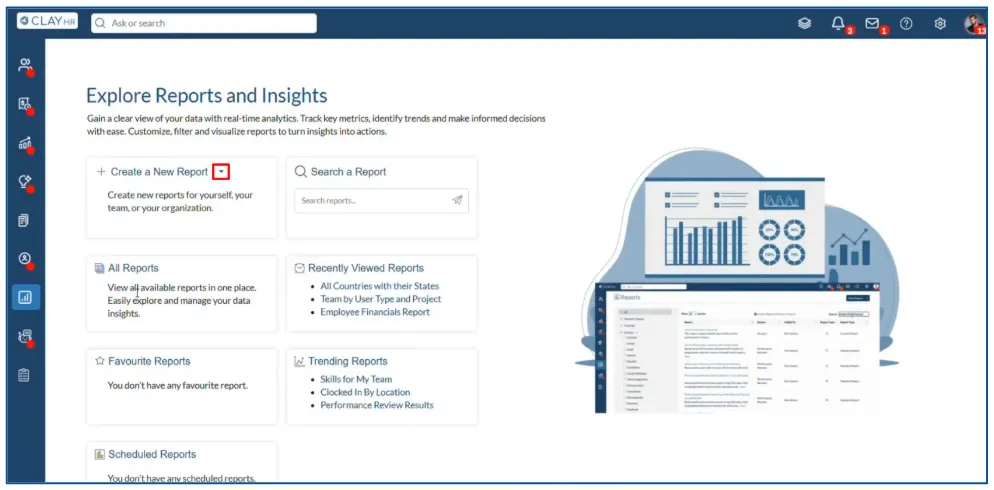
You can also create an AdHoc report. To create an AdHoc report, simply click on the dropdown icon next to “Create a New Report”. The “New AdHoc Report” button will appear below. Click on that button and you will be taken to the report designer page.

Note: The rest of the report creation process is similar for both simple and AdHoc reports. Depending upon your needs, you can either create a simple report for regular usage or an adhoc report for one time analysis which you can save later if you want.
Setting Up Data for the Report
On the Report Designer page, you can configure the specific type of data you want to include in your report.
Follow the steps below to set up and organize the data for your report effectively:
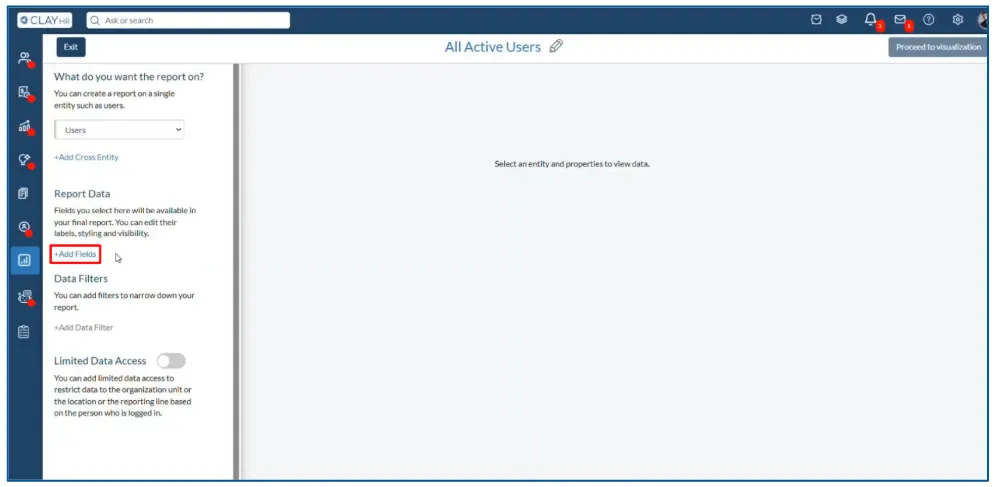
- Go to the left side panel and select an entity from the drop down menu. You can also add up to two cross entities.

- Go to the “Report Data” section and click on “Add Fields”. The “Add Fields” pop up window will appear.
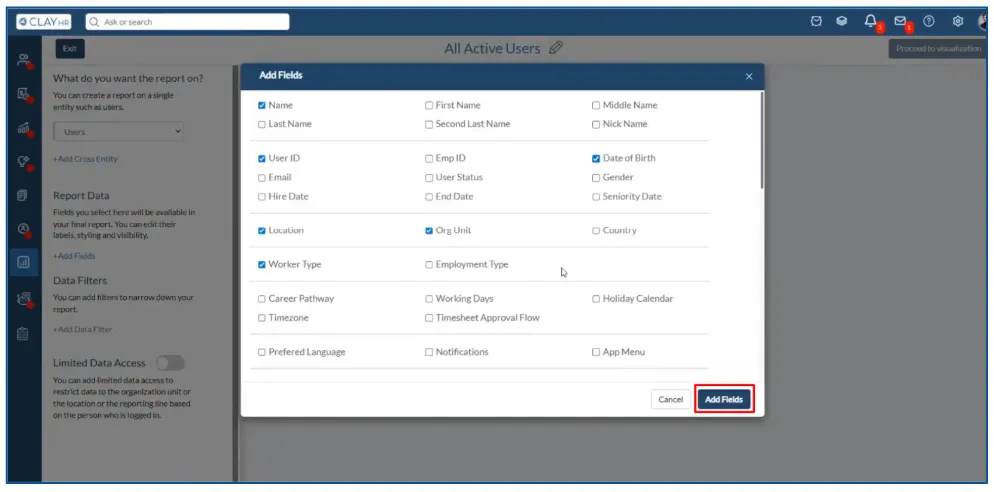
- Select all the fields that you want to add in your report. After you are done, click on the “Add Fields” button. The selected fields will be added successfully to the report.
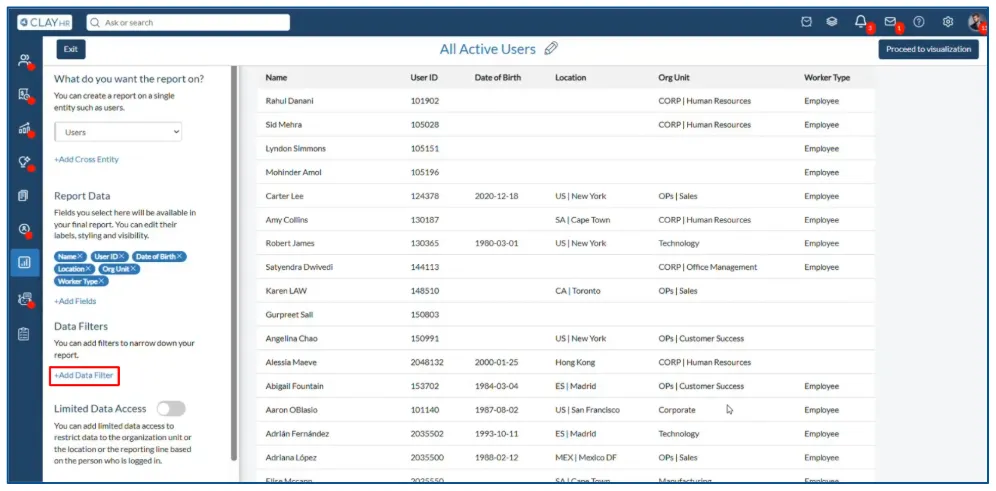
You can also select what kind of data is to be included in the report by applying data filters on the added fields.
To apply a data filter on a field, follow the given steps below:
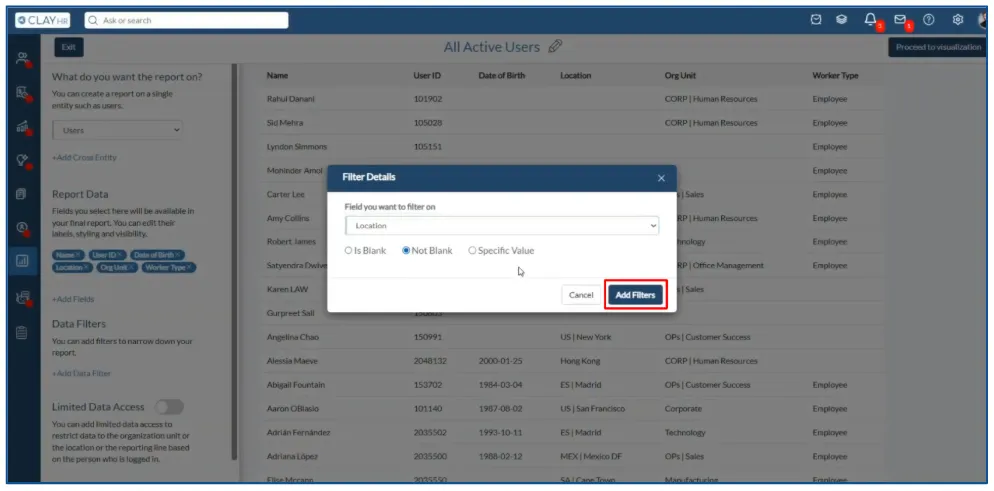
- Go to the “Data Filters” section and click on “Add Data Filter”. The “Filter Details” pop up window will appear.
- Select the field on which you want to apply the data filter from the drop down menu.
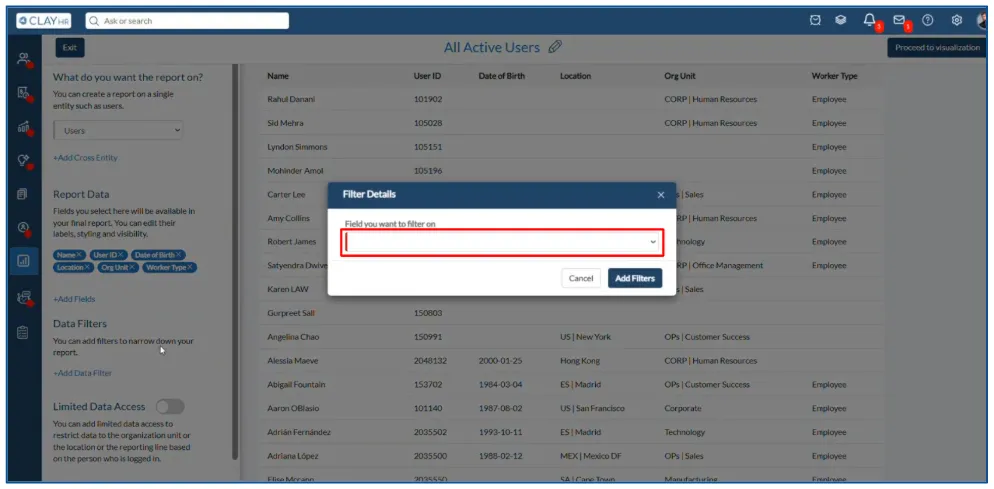
- Select the type of filter you want to apply on the field. Keep in mind that according to the data type of the selected field, filters that are available will vary.

- Click on the “Add Filters” button. The data filter will be applied successfully to the report.
You can also rearrange the sequence of columns to match your requirements. Simply click and hold a column, then drag and drop it to your desired position.

You can also limit the data that can be viewed by each individual in the report.
To apply limited data access to your report, follow these steps:
- Scroll down to the bottom of the left panel and turn on the “Limited Data Access” toggle.

- Click on “Add Limited Data Access”. A pop up window will appear.

- Select the type of data limitation you want to apply.
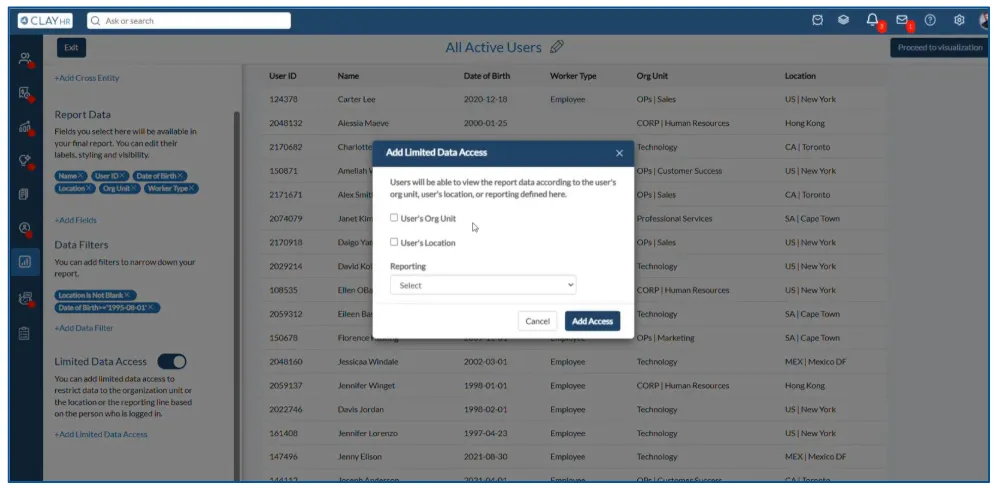
- Click on the “Add Access” button. The data limitation will be added to the report.

Once you are done setting up the data for your report, click on the “Proceed to Visualization” button at the top right side of the page. You will be redirected to the report visualization page.

Adding Visualization and Report Filters
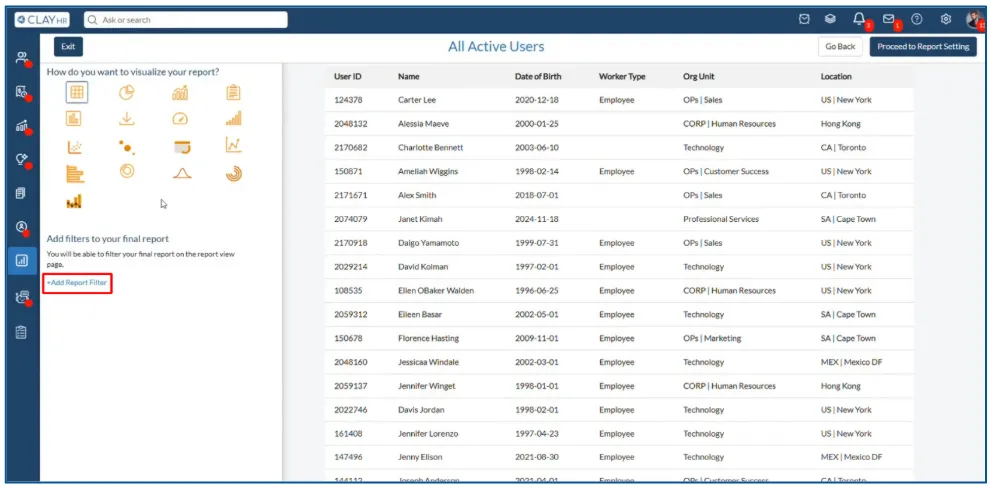
ClayHR offers 17 different visualization options to enhance your reports. The visualization section is located at the top of the left-side panel on the report visualization page. To apply a visualization, simply select your preferred type and it will be applied to the report.

Note: Each visualization has its own requirements to work correctly. Please refer to this article to know about different visualization types.
You can add report filters to your final report, making it easier for viewers to categorize and analyze data.
Here are the steps to add a report filter:
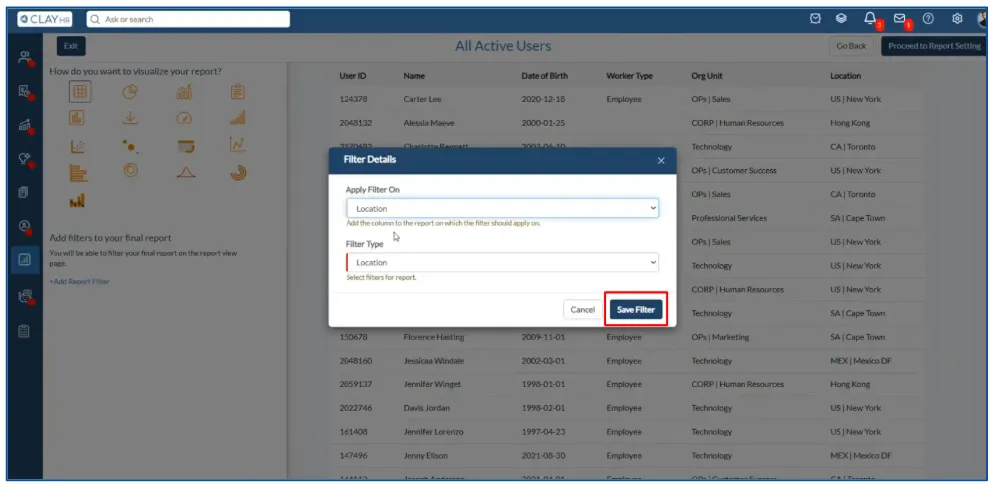
- On the report visualization page, click on “Add Report Filter”. The “Filter Details” pop up window will appear.
- Select the field and the type of filter you want to add for the report.
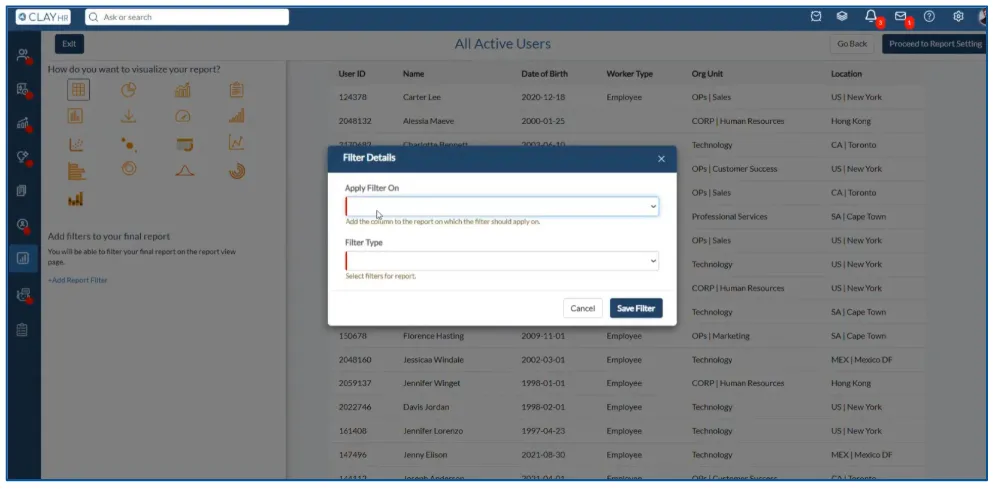
- Click on the “Save Filter” button. The filter will be added successfully to the report.

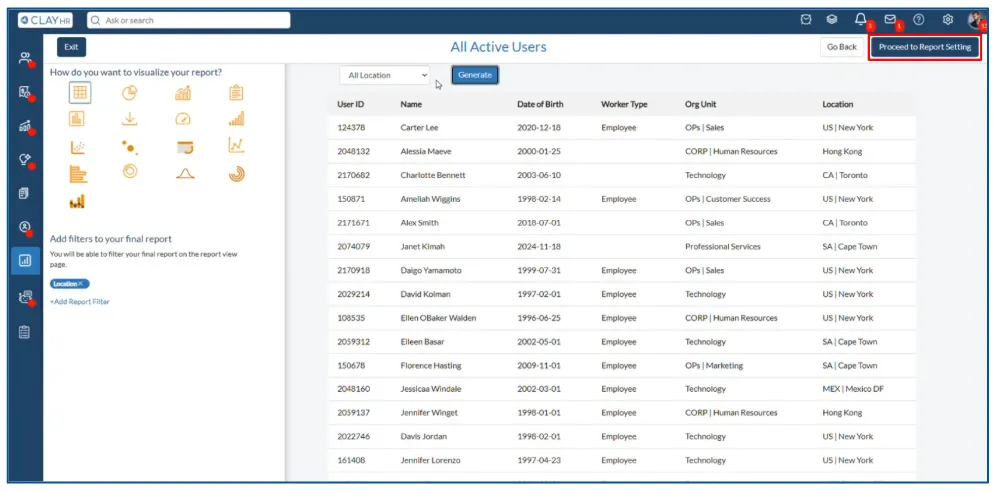
Once you are done setting up your report, you can proceed to the report view page. However, there are still additional configuration options on the reports visualization page, which you can use according to your needs.
To make use of these configuration options and go to the report view page, follow the given steps:
- Click on the “Proceed to Report Setting” button on the top right side of the page. A right panel will open up.
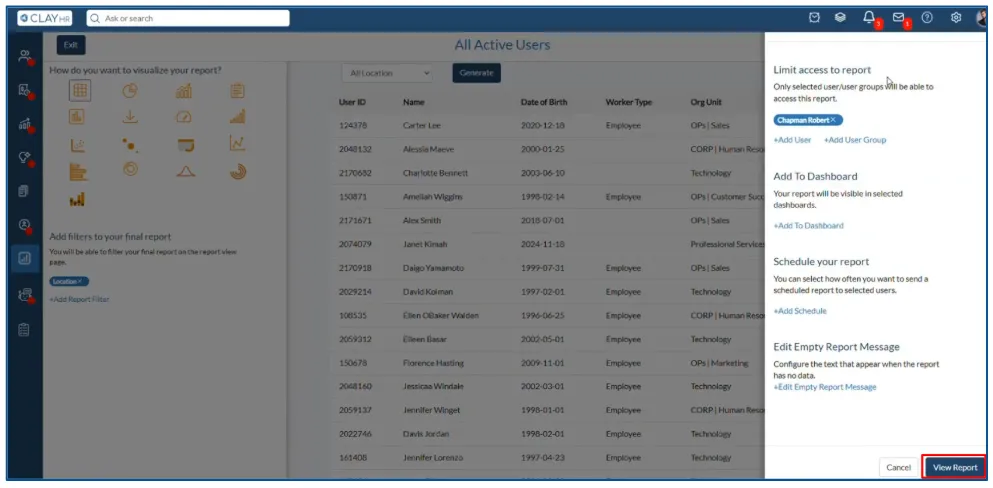
- You can set additional report configurations such as report access, adding the report to a dashboard, scheduling it, or setting a custom message for when no data is available.

- Click on the “View Report” button. You will be redirected to the report view page.
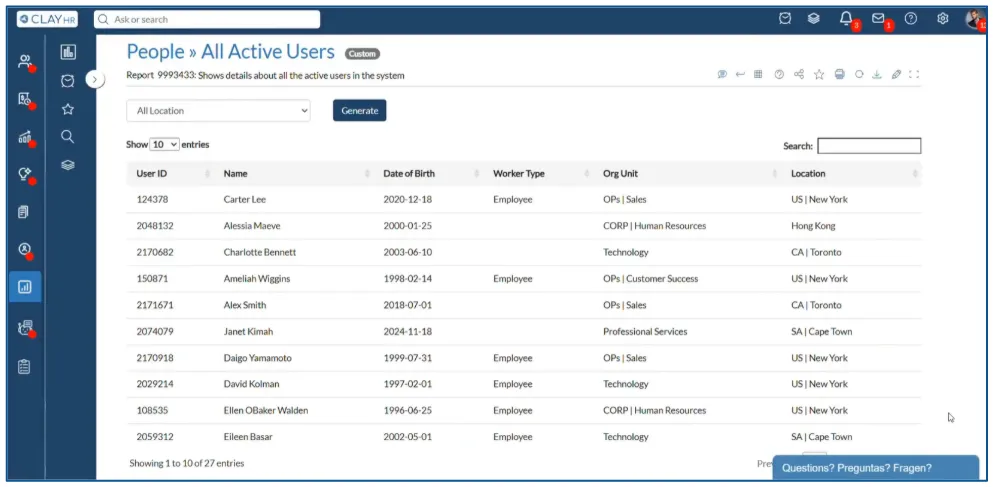
As you can see, the report has been created successfully. You can create multiple reports by following the above steps.